決まり物で大量にある場合はイラストレーターで作るより楽です。
他媒体への流用がある場合には不向きですが、使い方によっては修正も楽だし
ま~使えるのではないでしょうか。
set e to 30 —グラフの最大値
tell document 1 of application “Adobe InDesign CS2_J“
set a1 to cells of selection
repeat with a2 in a1
try
set selection to a2
set {a, b} to {contents of selection as real, width of selection}
set c to ((a * (b * 0.01) * (100 / e)) + 0.3)
set d to (b – (a * (b * 0.01) * (100 / e)))
set selection to every text of selection
set properties of selection to {left indent:c, rule above right indent:d}
end try
end repeat
end tell
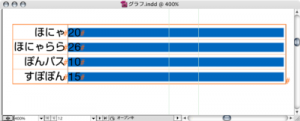
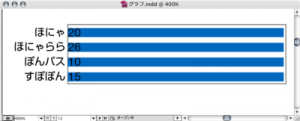
表組み機能で下のような表を作り数値部分のセルを選択してスクリプトを実行。
青い線は段落境界線を使っています。
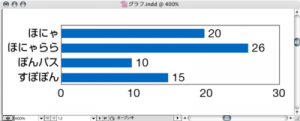
実行後下のようになります。
グラフ下の数値は手入力。


